Tool Usage Guides
Simple guide on how to use Interactive FACT BOOK
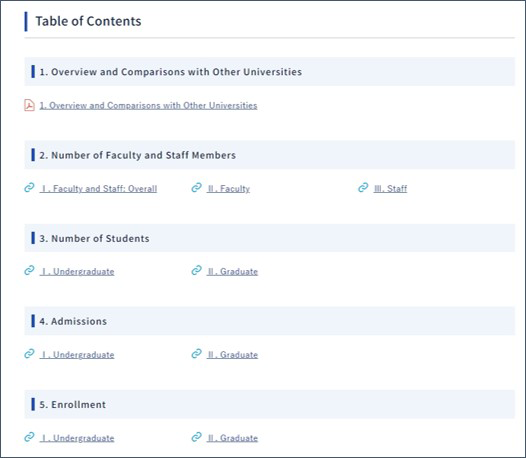
How to Use the Table of Contents Screen
Chapters are divided by categories. Click on a category to transition to the graph screen.
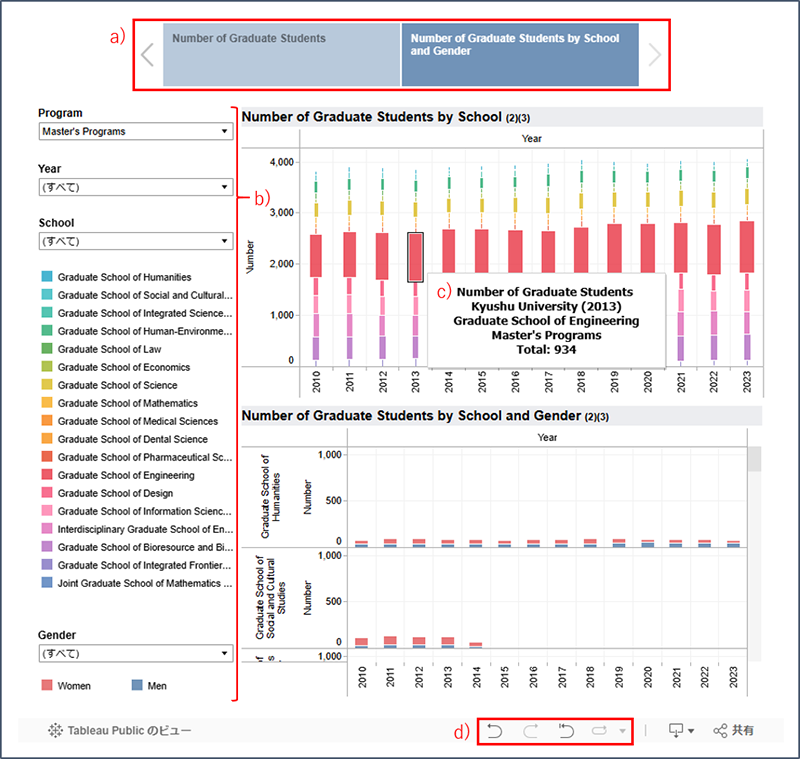
How to Use the Graph Screen
a) Select the data to be displayed.
b) Apply filters such as year, organization, job title, etc. (The filter options vary depending on the data displayed.)
c) Hover the mouse cursor over the graph to display detailed information.
d) You can undo or redo operations such as switching display items and applying filters.